.png)
A Practical Roadmap: From Customer Feedback to Root Cause Analysis (Part 1)
The Story: Elaine’s Challenge
Elaine is a CX professional. Every week she scrolls through reviews, survey results, social media mentions, and customer chats. At first, it feels like she’s just reading complaints: “Payment failed again,” “Delivery was late,” “App keeps crashing.”
But then she notices something: these complaints aren’t random. They repeat. They spike. They cluster.
Even without access to internal data like system logs or CRM records, Elaine realizes feedback alone can reveal patterns worth acting on. That’s where her root cause discovery journey begins.
%20(1).png)
Why Feedback-Only Still Matters
Not every CX team has immediate access to deep operational data. That’s normal. But analyzing feedback channels; tickets, reviews, surveys, calls, social posts, still creates real value.
With feedback-only, you can:
- Spot recurring issues that customers keep raising.
- Benchmark against competitors since public data is visible for everyone.
- Take meaningful steps forward instead of waiting for perfect conditions.
It may not uncover every root cause, but it helps CX teams build momentum, credibility, and a data-driven starting point.
The Roadmap in Action
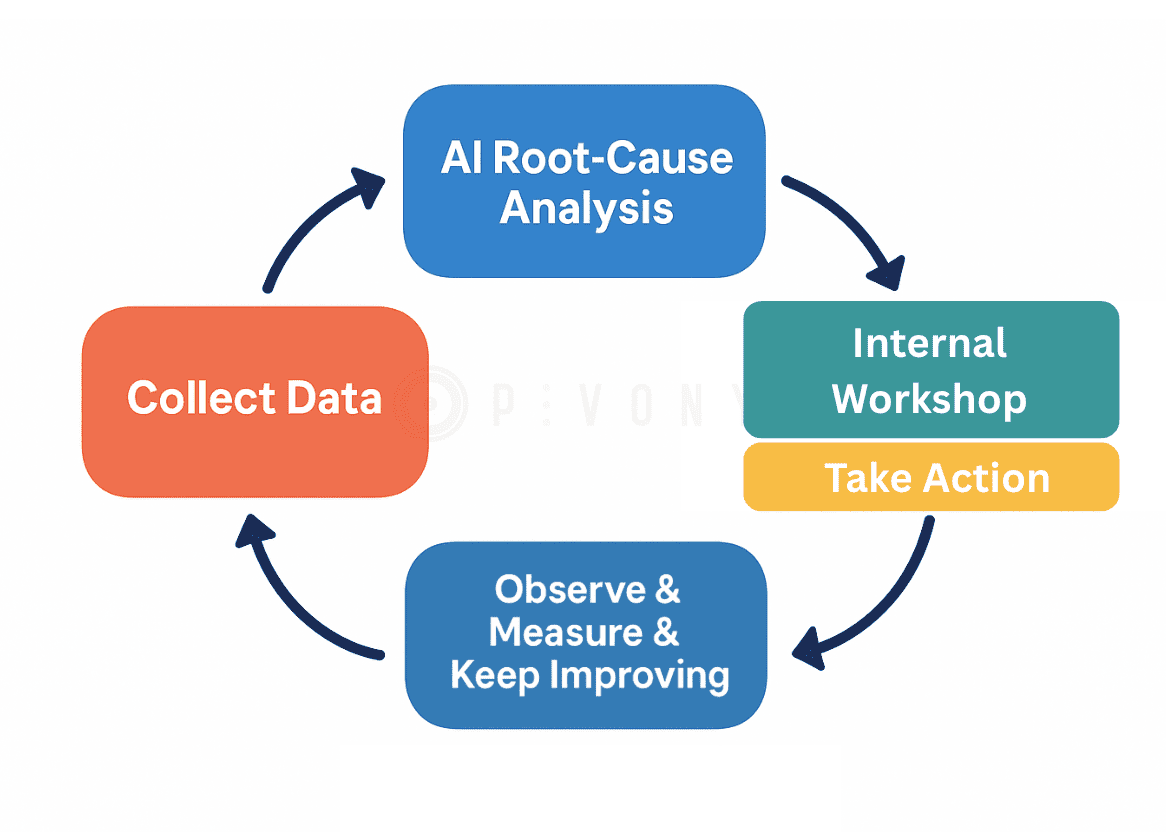
Here’s a simple, repeatable loop you can use with your team when working with feedback data only:
- Collect Data
Gather customer comments from reviews, social, support tickets, and surveys. - AI Root-Cause Analysis
Use text analysis tools to group related complaints, detect spikes, and prioritize common pain points. - Internal Workshop
Bring your team together around one chosen issue. Discuss what customers are really telling you and brainstorm possible causes. - Take Action
Roll out a quick, visible fix, whether it’s improved wording in the app, a proactive help article, or a policy tweak. - Observe, Measure & Keep Improving
Compare before-vs-after feedback using simple metrics (NPS, sentiment balance, complaint volume, or Pivony’s Digital Experience Score).
Elaine started by gathering customer voices from reviews, support tickets, surveys, and social posts. At first glance, it felt like noise. Too many complaints, too many channels. But she refused to be overwhelmed.
Using simple analysis tools, she grouped the feedback. Payment failures, delivery delays, app crashes, they weren't random. They formed patterns.
Instead of chasing every thread, Elaine brought her team together around one key issue: the one that mattered most and could actually be fixed quickly. In that workshop, they read real complaints aloud, aligned on one “why,” and sketched out a small fix, like clarifying the "Retry QR Payment" message and publishing a quick “How to” tip.
With the change live, Elaine tracked feedback again. Did negative mentions dip? Did NPS tick up? Did sentiment shift?
That’s the power of the loop: feedback → insight → action → proof. No complex dashboards, no exclusive access required, just customer voices, focus, and follow-through.
Step 1: Kick-Off
Elaine began by pulling together the last 30 days of feedback, everything from support tickets to app reviews, survey comments, and social media posts. She didn’t want to drown in data, so she kept it simple: one timeframe, one clean starting point.
To give the exercise focus, she picked a single KPI. Sometimes it was NPS, other times complaint volume or app ratings. The point wasn’t to measure everything, it was to keep the team aligned around a clear signal.
Before diving in, Elaine reminded everyone in the room: “We’re not here to fix every problem today. We’re here to find one problem worth solving.” That clarity gave her team permission to stop chasing noise and start moving toward progress.
Step 2: Discover Key Problems
“Noise is everywhere. Insight is in the patterns.”
Elaine didn’t just skim through the feedback; she searched for what was changing over time. By comparing the last 7, 14, and 30 days, she quickly spotted which complaints were suddenly rising and which ones were fading. These shifts told her what was urgent, what was new, and what might turn into a bigger problem if ignored.
Next, she grouped similar comments together. Categories like payments, deliveries, app crashes, and store hours began to stand out. By clustering them, the overwhelming flood of noise transformed into clear, repeatable patterns.
But Elaine knew that context mattered. The same issue could look very different depending on its source. So she sliced the feedback by channel and region: Was the complaint more common in tickets or reviews? Did one market complain more than another? Were customers saying “tap to pay” in one country and “QR” in another? Looking at the same theme through these lenses made the patterns sharper and far more actionable.
Still, Elaine couldn’t solve everything at once. She prioritized using three simple factors: how many people were affected, how severe the impact was, and how quickly her team could fix it. This focus pointed her straight to the right starting point.
.png)
Root Cause Analysis Methods
While Elaine often used the 5 Whys technique to uncover hidden causes, she also explored other root cause analysis methods to strengthen her approach. Each method provided a different lens to look at problems:
- Fishbone Diagram (Ishikawa): Helps visualize all possible causes: people, process, technology, environment in one diagram. Elaine used this when problems seemed too complex for just asking “Why?” five times.
- Pareto Analysis (80/20 Rule): Focuses on identifying the “vital few” causes that lead to the majority of complaints. For Elaine, this was useful when multiple issues competed for attention.
- Failure Mode and Effects Analysis (FMEA): A systematic way to anticipate potential failures and prioritize them by severity, occurrence, and detection. Elaine’s team used this for product reliability and customer experience risk assessment.
- Fault Tree Analysis (FTA): A top-down, logic-based diagram that breaks a problem into smaller contributing events. Elaine applied this in technical issues where multiple systems were connected.
By combining these root cause analysis methods, Elaine ensured her team wasn’t just reacting to problems, but building a long-term framework for prevention and continuous improvement.
5 Whys Root Cause Analysis Example (Elaine’s Case)
When complaints about failed payments started to grow, Elaine wanted to understand the real reason. Instead of blaming the payment gateway, she guided her team through a 5 Whys session:
- Why did the customer’s payment fail?
Because the payment page timed out. - Why did the page time out?
The server CPU usage was too high. - Why was CPU usage too high?
A heavy data-processing job was running at the same time. - Why was the job running then?
An automated report was triggered during that period. - Why was it scheduled during peak payment times?
Because reporting tasks were set without considering transaction traffic.
👉 Elaine’s conclusion: The real issue wasn’t the payment gateway; it was a poorly scheduled reporting process. By simply rescheduling reports, her team reduced payment failures and improved customer trust.
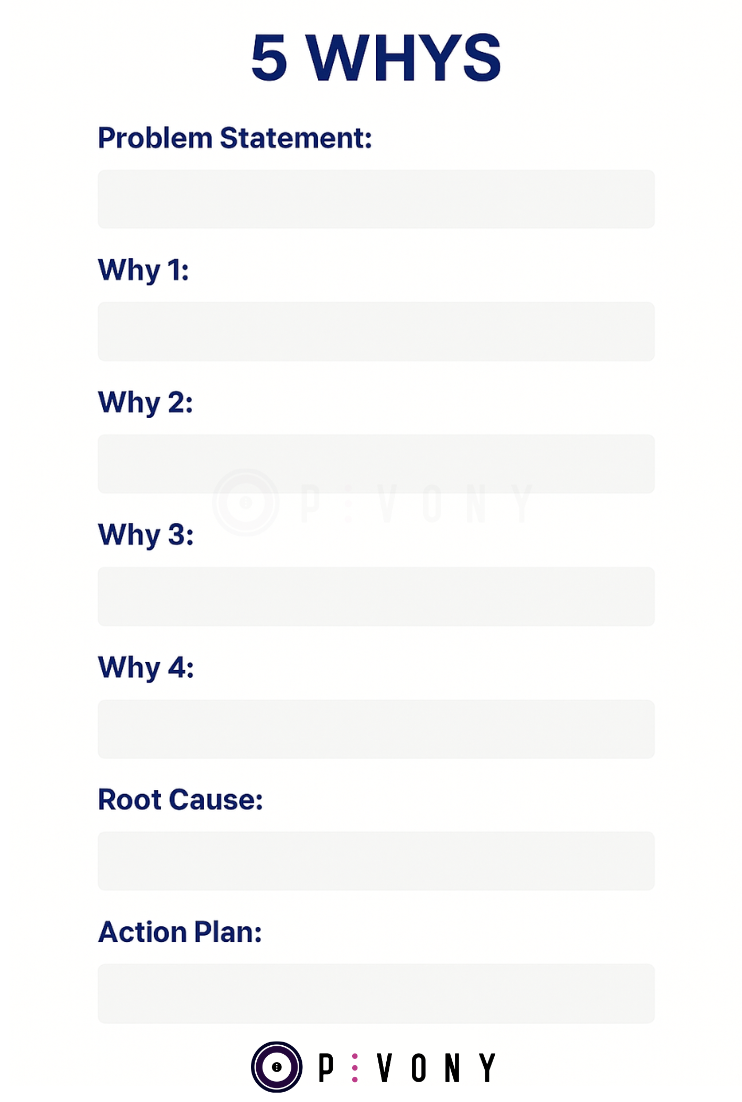
Free 5 Whys Template Download (PDF)
Looking for a quick way to run your own five whys root cause analysis? Download our free 5 Whys template and start applying the technique today. The template is available in PDF format, so you can easily adapt it to your team’s workflow.
Step 3: Recommendations & Fixes (15 minutes)
Elaine knew that discovering patterns was only half the job. To really make progress, she had to act. But instead of waiting for a massive project or a perfect solution, she aimed for something smaller: a visible win that her customers would notice right away.
She started brainstorming with her team. Sometimes the fix was as simple as tweaking the wording in the checkout flow so customers wouldn’t get stuck. Other times, it meant adding a quick Help Center article or a ready-to-use macro so support agents could deflect repeat questions faster. They also looked at policy and process adjustments, like making refund communication clearer or setting more realistic delivery windows. And in some cases, the answer was just better communication, posting a status banner, pushing an in-app tip, or sending an alert email before customers felt the pain.
From all these options, Elaine and her team picked just one quick fix to implement immediately. It wasn’t about solving everything in one go. It was about showing customers and leadership that change was happening, and momentum was building.
Step 4: Time to Measure
Elaine and her team didn’t just stop after rolling out the fix, they wanted to know if it actually made a difference. After all, as the saying goes, “You can’t improve what you don’t measure.”
So they wrote down what they had changed, who owned it, and when it should be completed. This wasn’t just for accountability, it gave them a way to look back and see progress over time.
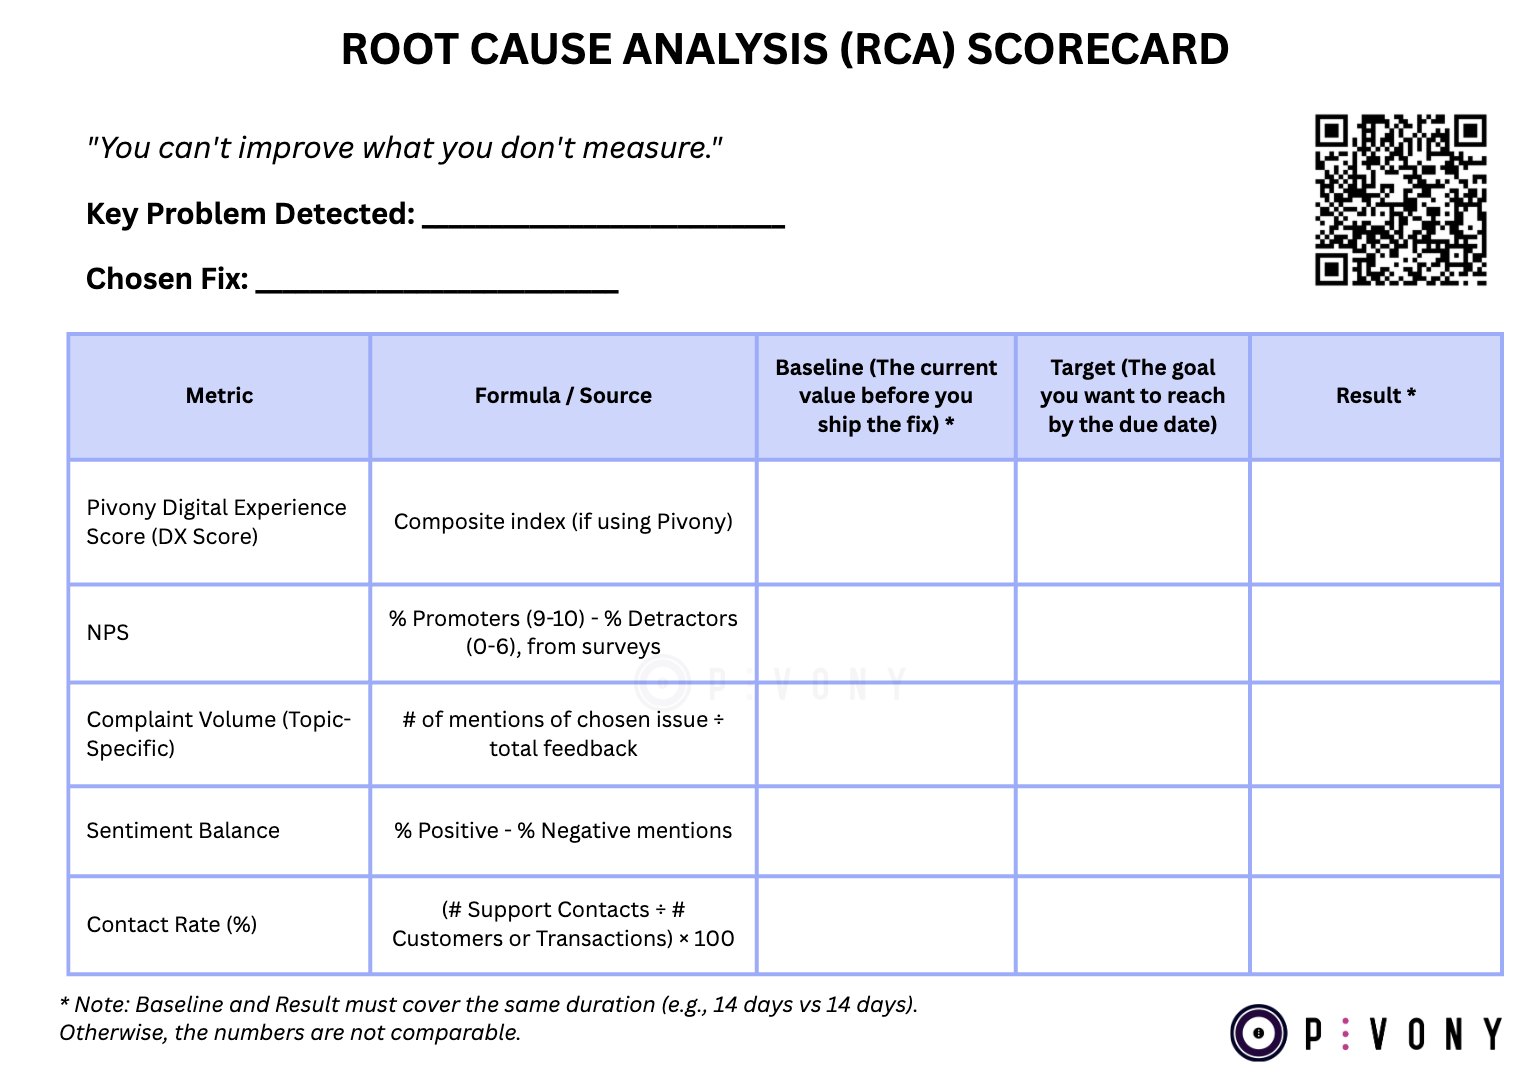
To track the impact, Elaine used a simple RCA Scorecard, where she logged both the actions and the outcomes. If her company had access to Pivony, she could rely on the built-in Digital Experience Score to see shifts in customer sentiment, benchmark her brand against competitors, and track improvements across topics.
But even without that, she still had valuable signals to follow: NPS, complaint volume around the chosen issue, or the share of positive vs negative feedback. These metrics, when viewed over time, told her team whether the fix was working, and gave her leaders confidence that CX wasn’t just a cost center, but a driver of visible progress.
Free Root Cause Analysis Scorecard Template Download (PDF)
Looking for a quick way to run your own root cause analysis scorecard? Download our free Root Cause Analysis Scorecard Template and start applying the technique today. The template is available in both PDF format, so you can easily adapt it to your team’s workflow.
Example: “QR Payment Failed”
- Symptom (feedback): complaints spike around QR payments. (AI-discovered)
- Possible quick fixes (feedback-only): (AI-generated + team decision to be made)
- Clearer instructions in checkout flow.
- Help Center article with screenshots.
- Proactive in-app banner with “How to use QR” tips.
- Impact to track: reduction in QR-related tickets, lower contact rate, higher NPS on payments. (Systematic monitoring)
Why Feedback-Only Still Wins
For Elaine, feedback-only analysis wasn’t about finding every answer at once. It showed her what customers were struggling with in the moment. It helped her rank which problems mattered most, roll out quick fixes, and show her leaders that things were improving. It didn’t solve every technical mystery, but it was a powerful way to build momentum, and a starting point for digging deeper later.
What's Next?
In this post, you’ve seen how feedback-only analysis works as a roadmap: symptoms → problems → quick wins → proof.
In Part 2, we’ll add light internal context (e.g., device/OS data, release notes, incident logs) so you can confirm true root causes and tackle deeper issues.
Want to see your own customer feedback transformed into clear priorities and quick wins?
Book a Pivony demo today and uncover your top opportunities in days.